Singapore HDB Resale Price Prediction : Modelling
In previous post, we have performed data wrangling, as well as some simple data exploration and visualisations to understand more about the Singapore HDB resale dataset. Finally we have reached the exciting part: modelling! We will try out several models and compare the accuracy for each model, and more importantly, discuss about why certain model has a better performance.
As mentioned before, there are 8 features I selected for the final modelling. 4-Room flat type HDB resale transactions data since 2005 are used as input data for model training and testing.
 Final Dataset to be used for resale price prediction model
Linear Regression Model
I started off with a linear regression model. The main advantages for linear regression model is less parameters to tune, and the results are relatively easy to interpret. For this project, I used the sklearn library which is the most popular toolkit nowadays for data science projects.
The code for building up this model is quite simple, I will not elaborate too much details here. All the source code will be available in this link.
 Linear Regression Model
One thing to highlight here is that linear regression function uses R² (coefficient of determination) regression scoring function. This enable us to visualise the testing results in the percentage form.
R² is defined as (1 — u/v), where u is the residual sum of squares ((y_true — y_pred) ** 2).sum() and v is the total sum of squares ((y_true — y_true.mean()) ** 2).sum(). The best possible score is 1.0 and it can be negative (because the model can be arbitrarily worse).
With linear regression model, I got ~79.7% accuracy from test data set without any additional parameters tuning. A pretty good start!
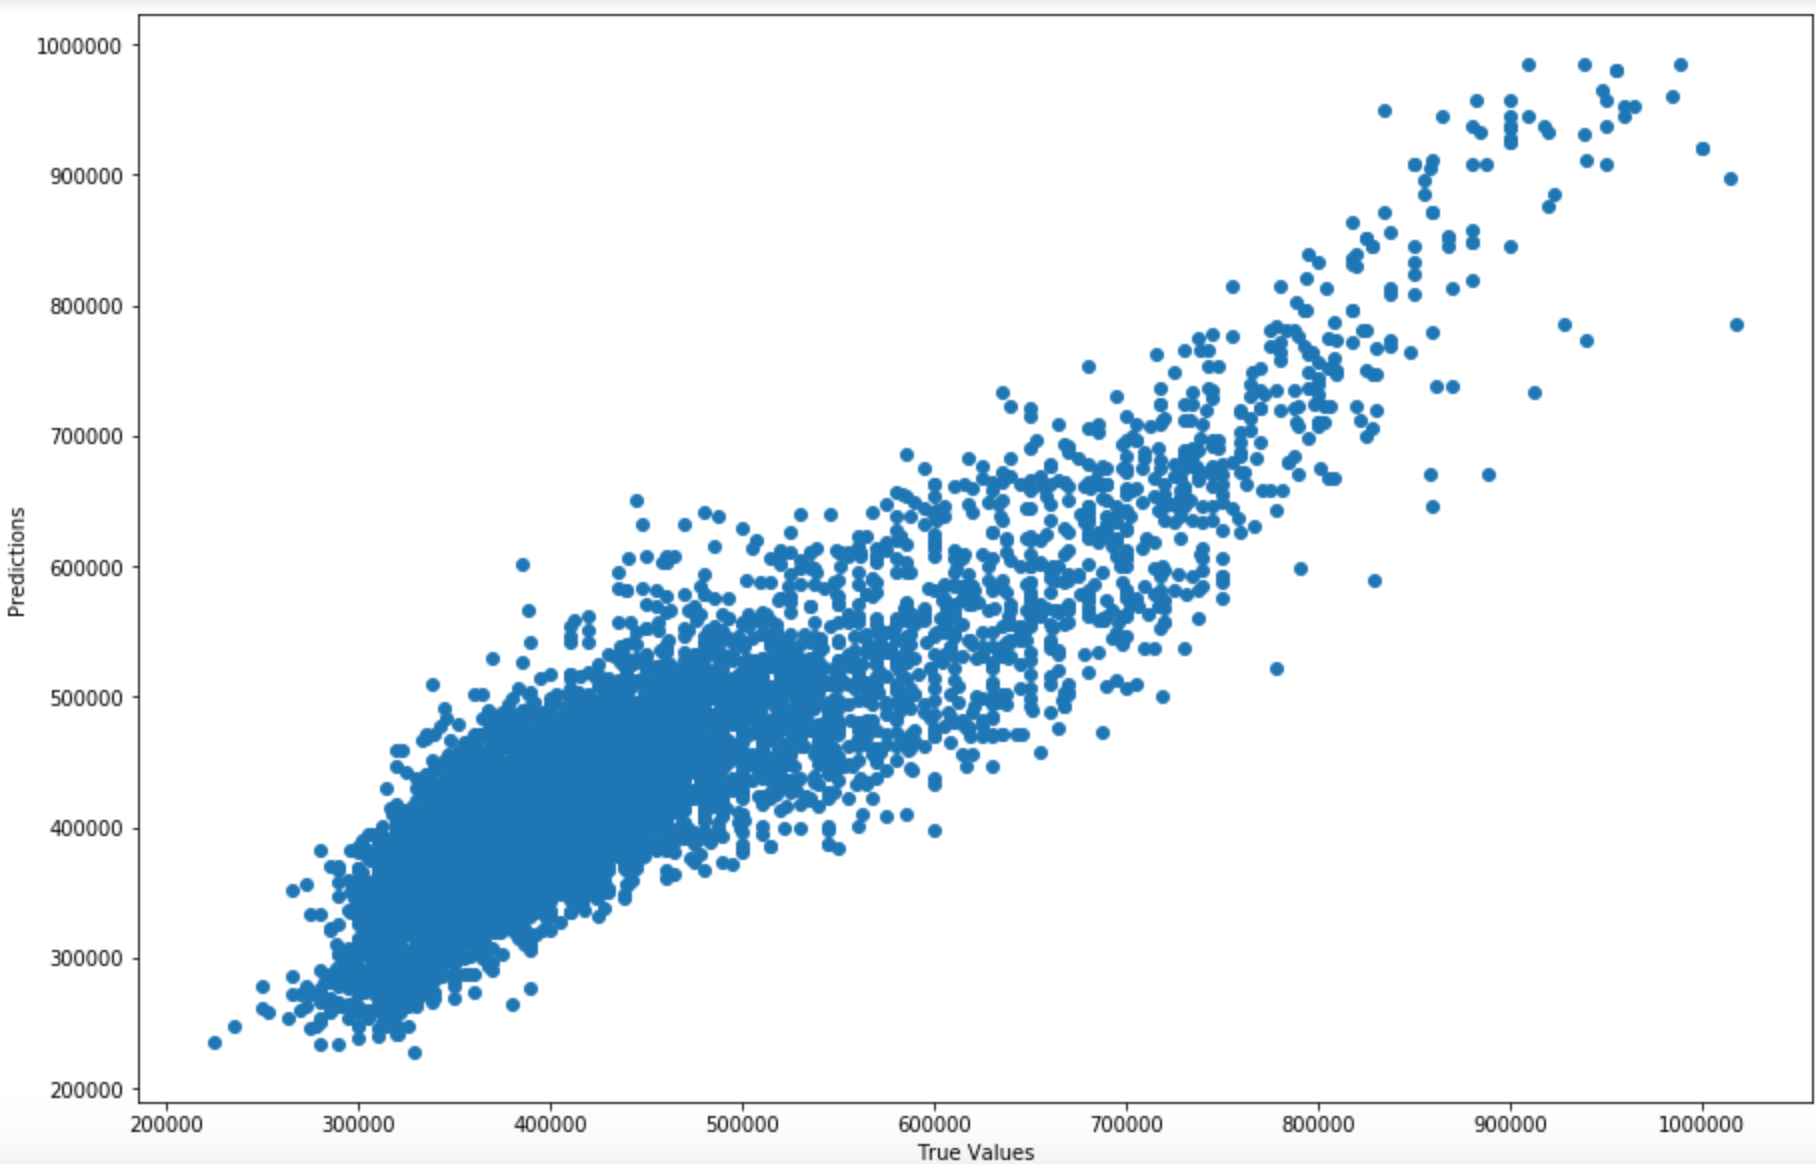
 Linear Regression Model Prediction value v.s. Actual value
This is the graph showing the correlation of true values and prediction values from Linear Regression model. We can see they generally follow the linear trend. We can also notice that the point density in the range of 30K to 55K is higher— In a sense, the resale price dataset is also imbalanced with more transactions ended in the 30K to 55K resale price range.
Gradient Boosting Regression Model
While 79.7% accuracy is a good start, are we able to achieve higher accuracy? Linear Regression model seems does not have much room for further improvement. Given our dataset is imbalanced in nature, with some further research I recall that gradient boosting regression model could be a good choice in our case.
Gradient Boosting Tree Algorithm is an ensemble learning method that build trees one at a time, where each of the new tree will put more weights on the data samples having a higher classification/regression error. It is good for processing imbalanced datasets, where the the algorithm can put more weights on the data samples which are harder to predict.
Similarly, there is available library in sklearn toolkit that we can directly use. The main parameters to tune is as follows:
n_estimator — The number of boosting stages to perform. We should not set it too high which would overfit our model.
max_depth — The maximum depth of the tree node. Too high will cause overfitting issues.
learning_rate — Rate of learning the data.
loss — loss function to be optimised. ‘ls’ refers to least squares regression, which is similar as out previous linear regression model.
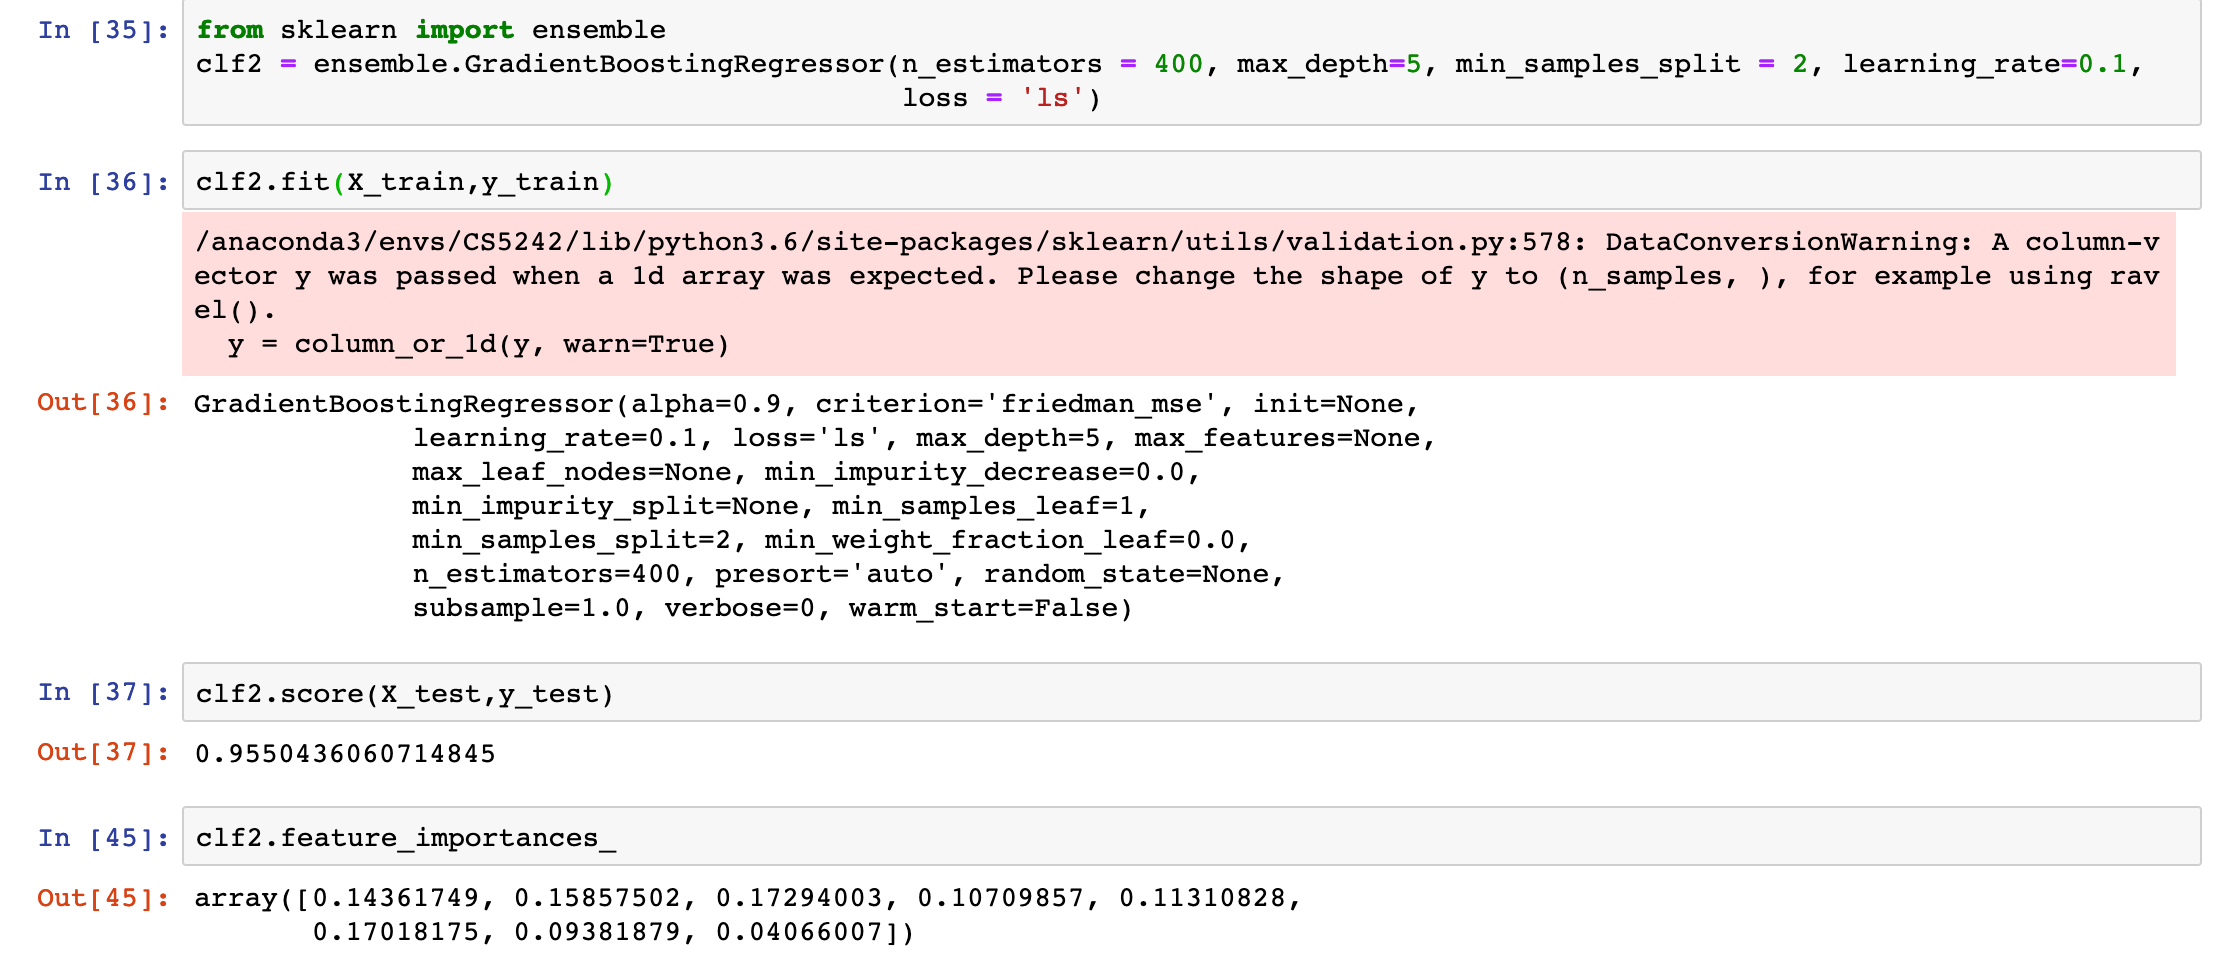
 Gradient Boosting Regression Model
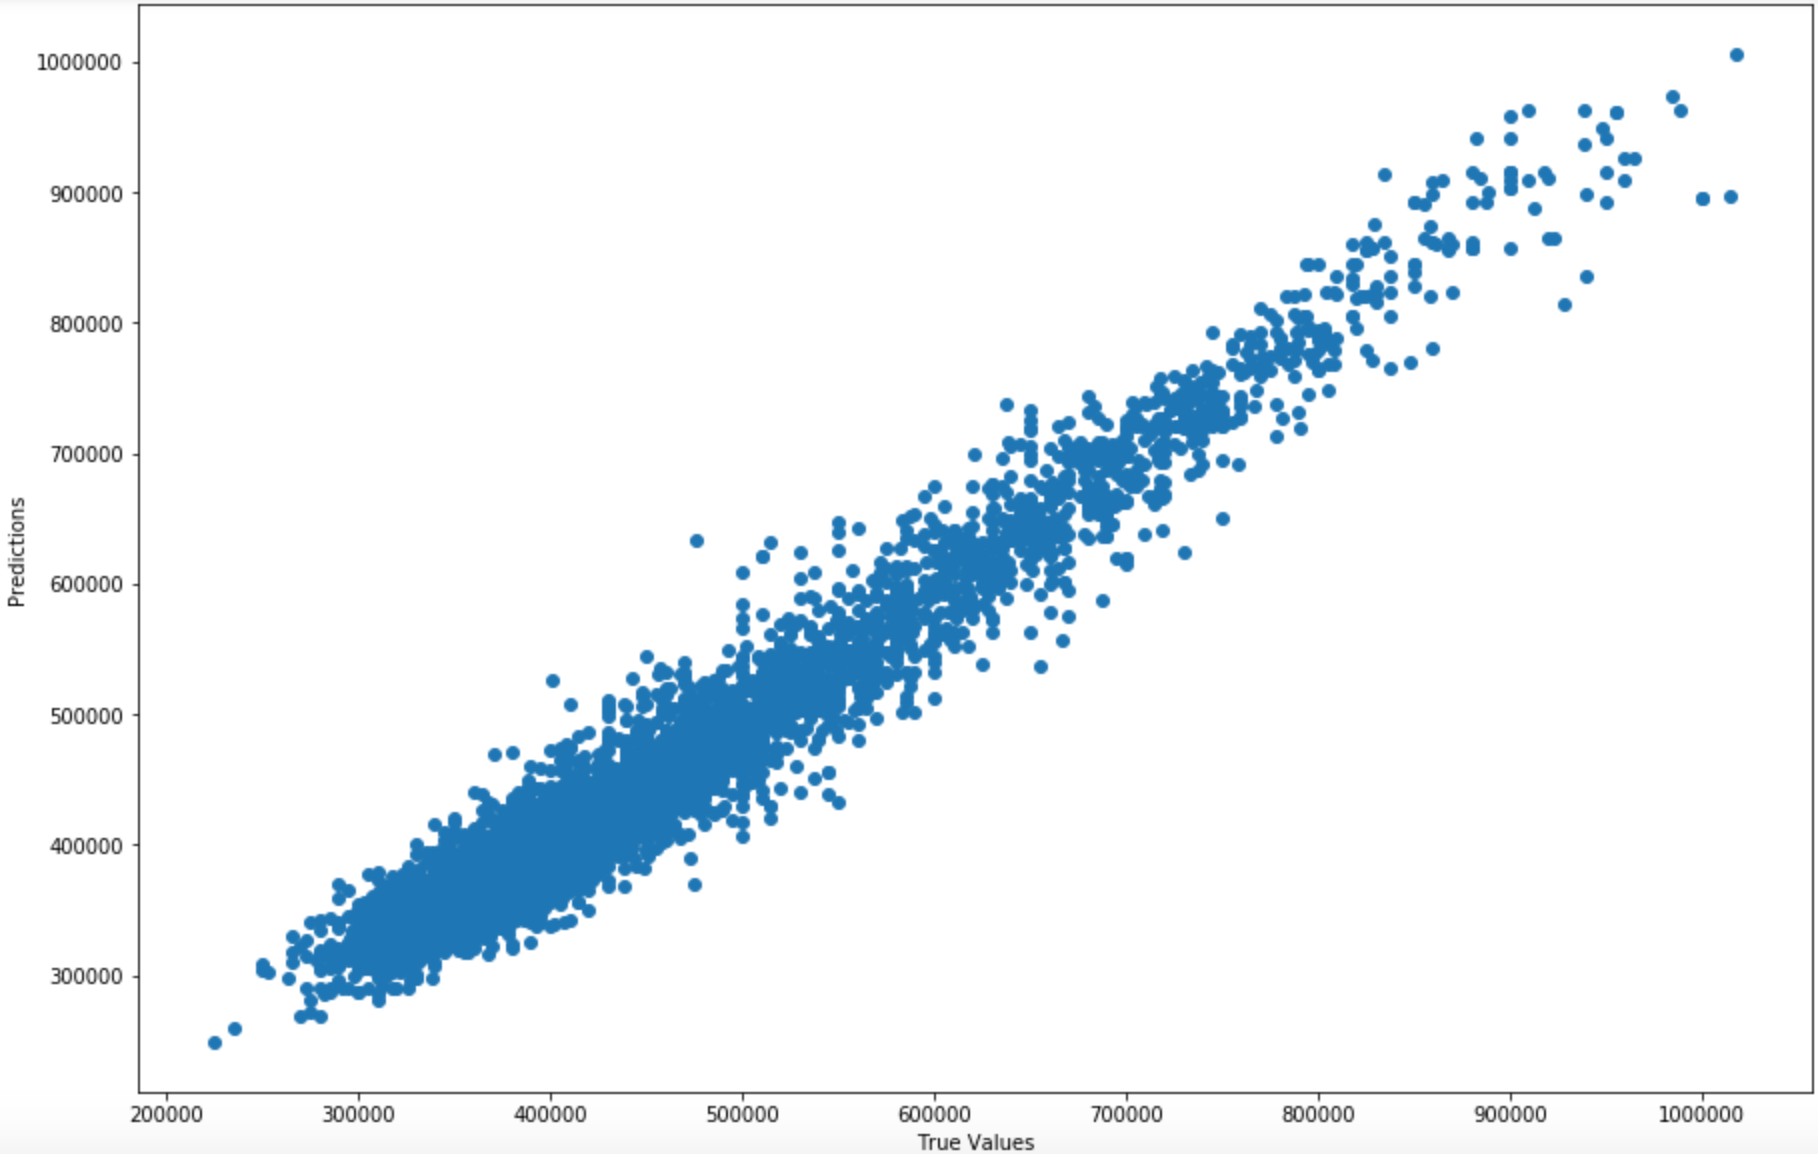
After training the model, we use the same test dataset to check the accuracy. And we reached 95.5% accuracy — pretty amazing! I have plotted the same correlation plot as the linear regression model, it is quite obvious that the result has a significant improvement.
 Gradient Boosting Model Prediction v.s. Actual
The feature_importances metric is an indication of what are the weights for respective features that determine the final HDB resale price. It is observed that floor_area, distance to closest shopping mall & MRT stations **and **remaining lease are having largest impact on the HDB resale price (≥ 15% weightage each). The travel time to CBD, storey level and town locations have ~10% impact each for final resale price. The least important features turns out to be the flat_model type, which accounts for 5% for overall resale price predicted value.
Linear Regression v.s. Gradient Boosting Regression
We see that gradient boosting model has a really good result comparing to linear regression model, with ~15% accuracy improvement. Why gradient boosting regression model out performed the linear regression model so much?
This suggests that from the given features, there should be non-linear elements that is not captured by simple linear regression model. Gradient boosting tree model uses decision trees as weak leaners. After calculating the loss, the model will select a decision tree that minimise the residual loss after each iteration to continuously improve the prediction accuracy. This is something that pure linear regression model cannot achieve.
Although the GBR is able to achieve higher prediction accuracy, it also has the downside which it is harder to interpret than linear regression model. We can only get a feel about what are the weightage of different features from the feature_importance *metrics mentioned above.*
Conclusion and Recommendation
In this project, we have performed a comprehensive study for Singapore HDB resale price dataset. We have gone through the dataset pre-processing, feature engineering, data exploration&visualisation and modelling stage for a data-science project. The key factors that would affect HDB resale prices have been identified, and finally a gradient boosting model for resale price prediction model is constructed with a prediction accuracy > 95%.
Although we have reached a high prediction accuracy, it should be also noted that the real HDB resale price is much more complex than what we have discussed in the model. There are many other factors such as overall economic conditions, government regulation, also the proportional of young working adults in respective towns that may play a role for the final resale price. These factors can be added for future works for further improvements.
When people are really considering buying an HDB, their priorities also varies case by case. For example, for a couple who works in Micron (which locates in the north coast of Singapore), they may just choose to buy a HDB in Woodlands or Yishun district which is close to their working place. For them, the travel time from home to CBD may not be of high priority, since most of the time they will just stay in the neighbourhood areas in the north part.
We have also identified several town locations such as Kallang, Ang Mo Kio and Serangoon, which might be a good place to consider for people who are looking for locations near CBD with a lower price.
Thank you for reading!
