Singapore HDB Resale Price Prediction : Data Exploration
In the previous post, we have performed data wrangling for Singapore HDB resale Price dataset, and identified some features that should be useful to build up the model later on. Before moving on to modelling, let’s explore the dataset a bit more to see if there any any interesting patterns we can find.
For this project, I used SAS JMP software to do data visualisation. JMP is quite convenient for simple data visualisation tasks with a user friendly user interface. You may want to refer to their official website for more details.
What is the overall trend for HDB resale price over the years?
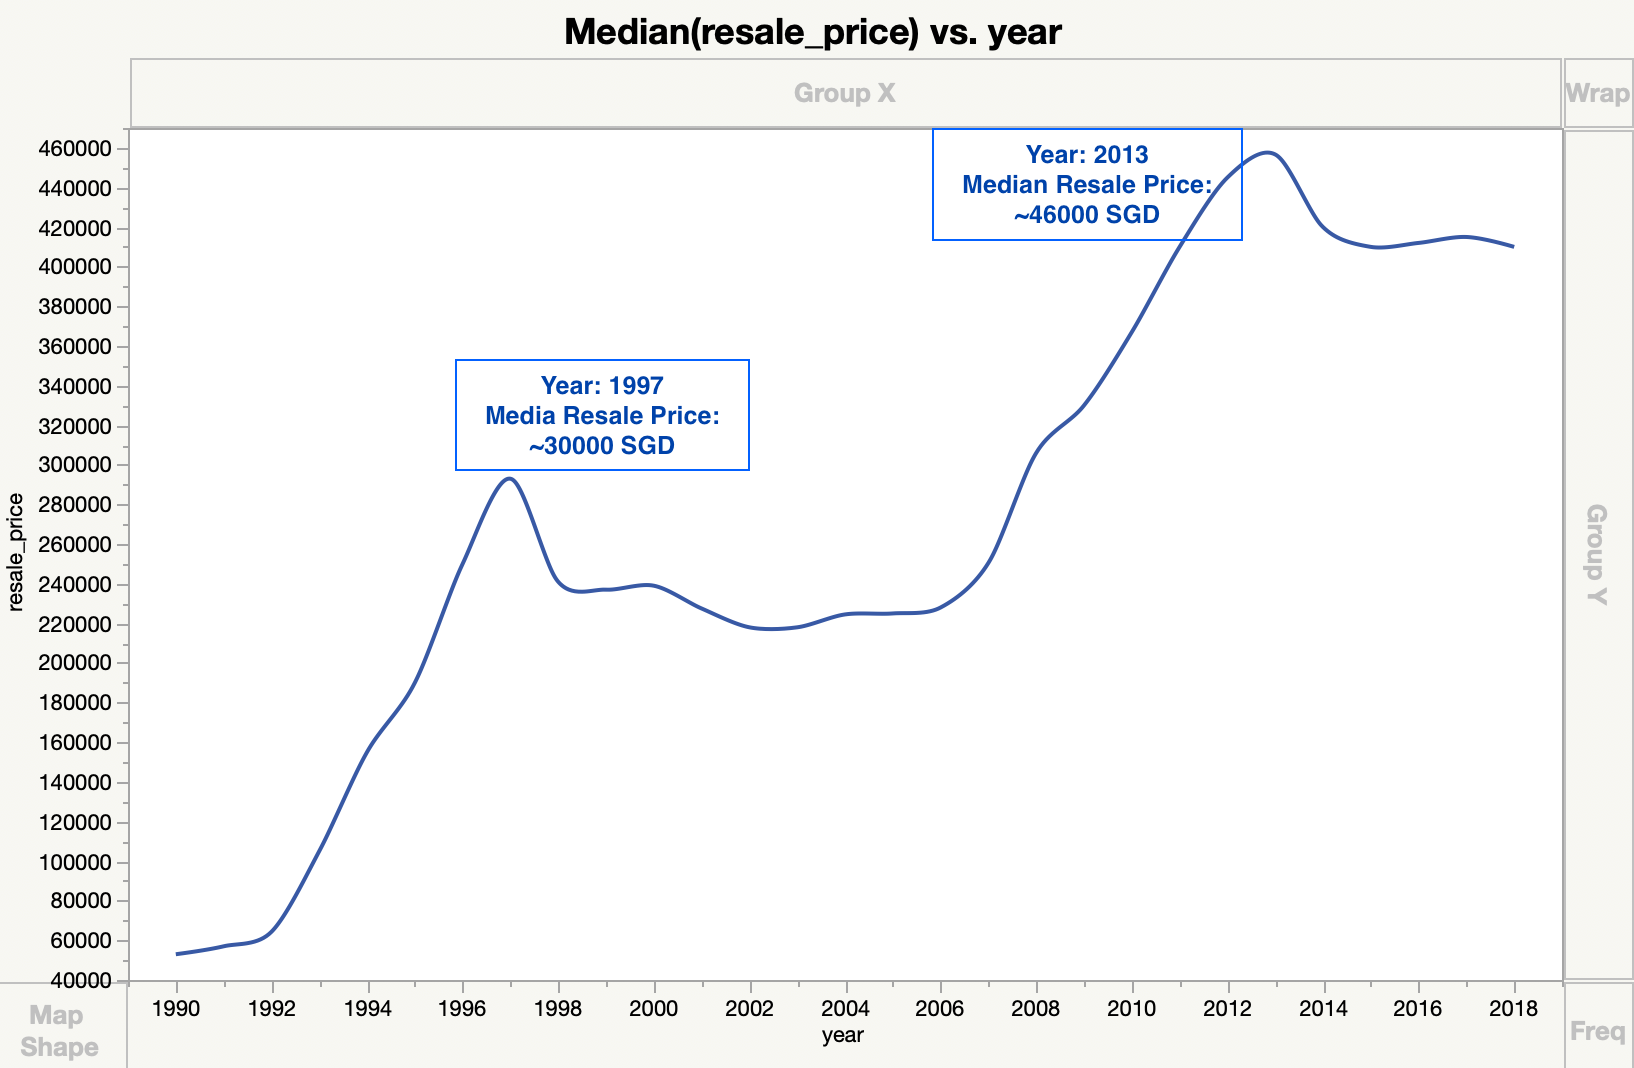
From the website, we can obtain the HDB resale price data ranging from 1990 to 2018. Lets see what is the overall trend for the median resale price:
 Singapore HDB Median price from 1990 to 2018
From this plot, it is observed that there are 2 peaks for HDB resale price. The first peak came at year 1997, followed by a significant drop which was mainly influenced by Asian Financial Crisis. After that, the HDB resale price started to increase again starting from 2006 and reached a new peak at year 2013. Then the price of HDB resale flats dropped again, which coincide with a series of cooling measures in public housing market, such as ABSD framework. From Year 2014 until now, the overall HDB resale price is quite stable looking from median value.
From this analyse, we get a rough idea about the overall trend for HDB resale price for the past 20 years. We can observe that Singapore HDB price might be affected by government policies and overall economic trend a lot.
Do different town areas have similar price trend?
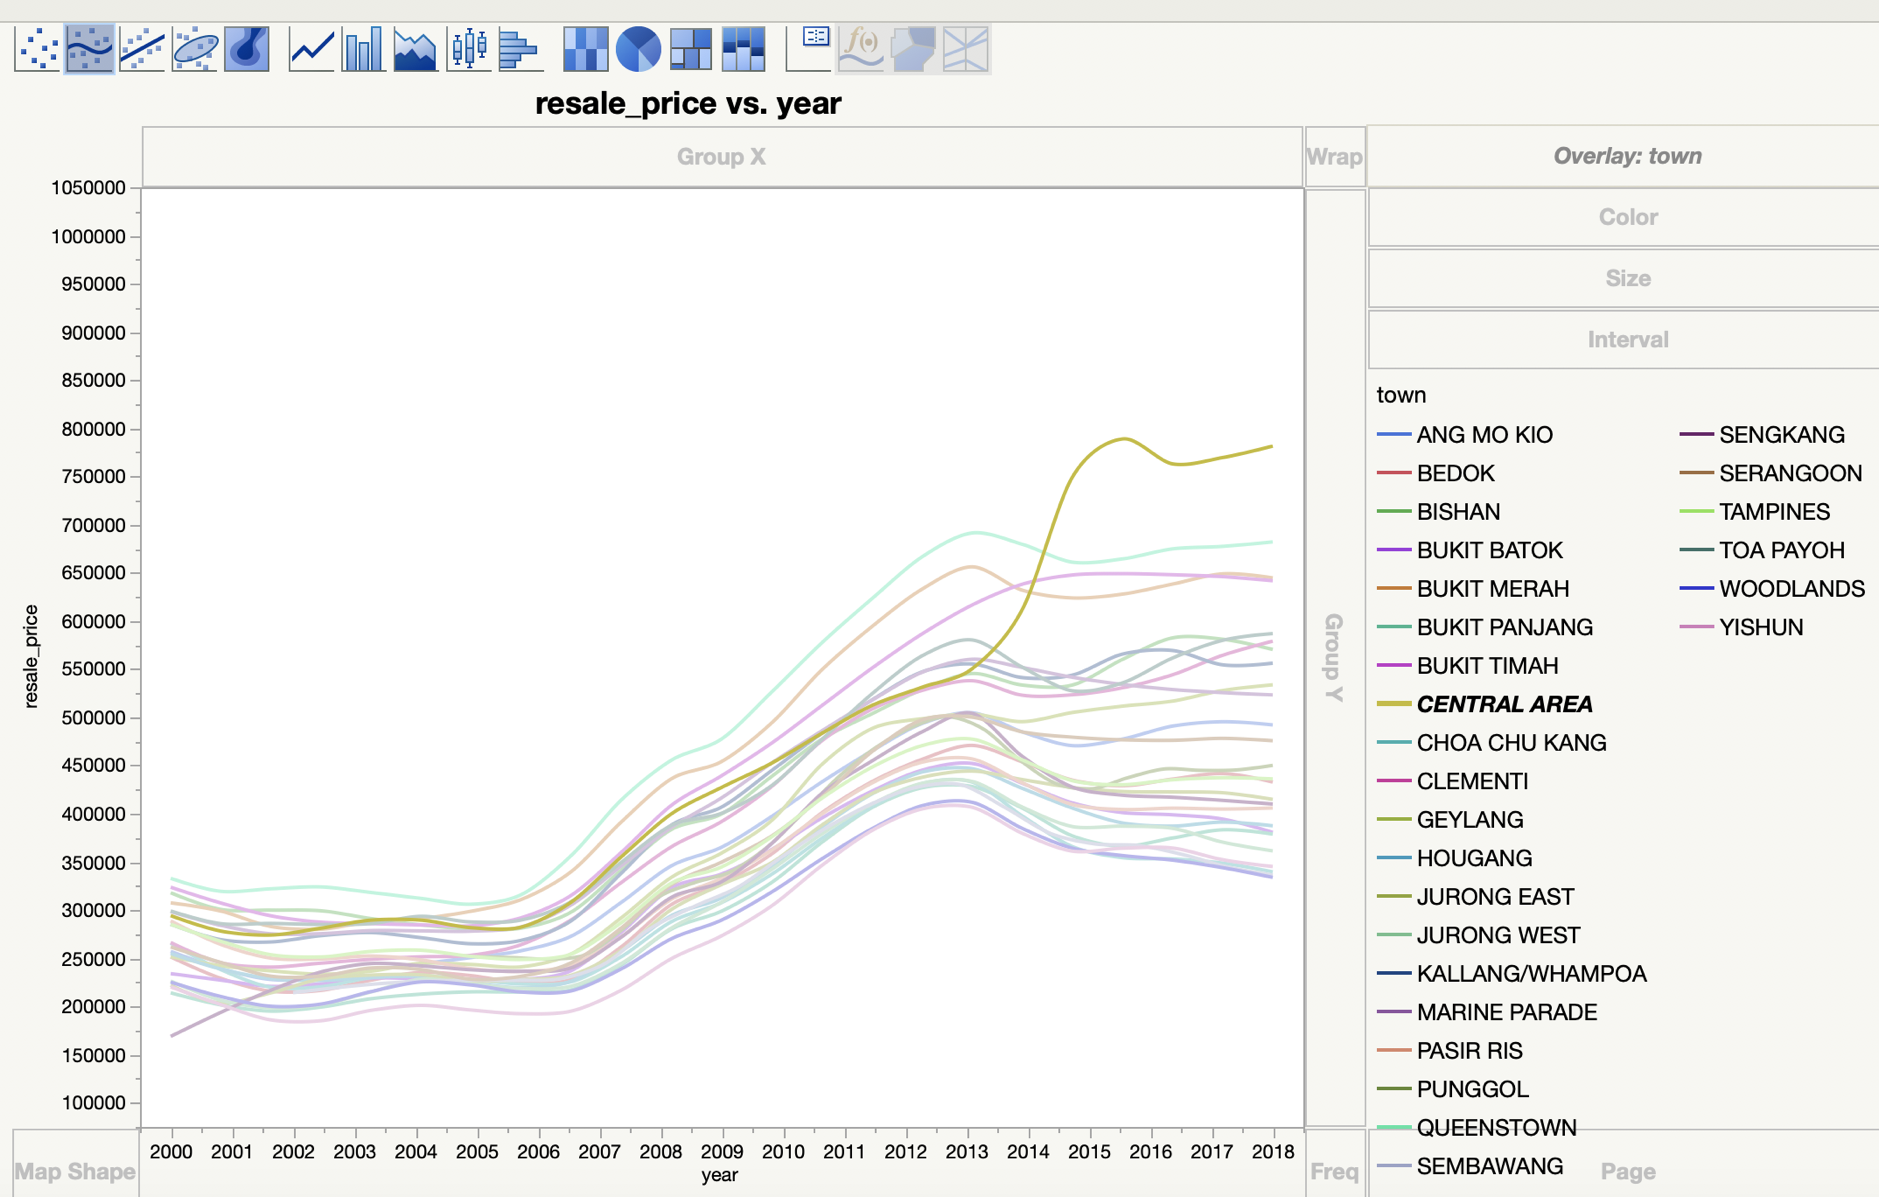
From the first plot, we learnt that the median HDB flat price from 2014 until now looks stable. Does this apply to all the town areas in Singapore? I have this doubts in mind, as I did notice some news that the HDB prices in central ares reaches historical high in recent years.
 4-Room HDB flat median resale price partitioned by town area
This plot shows the median 4-Room HDB flat price partitioned by town area. It is clearly observed that post year 2013, the central area HDB price goes up abruptly with an even higher slope than previous years. For other central regions like Queens Town, Bukit Timah and Bukit Merah, the resale price also runs on higher side. For town areas that are far way from CBD (such as Chua Chu Kang, Sembawang, etc), it is observed that the resale price does keep decreasing since 2013.
From this graph, we can see that even with all the cooling measures, the center area HDBs resale price still goes up. People are willing to spend more money for HDB in central areas to enjoy the convenience it brings. Moreover, the available spaces for building new HDBs in central area is very limited, which also makes the resale market in central area much hotter than other regions. For the towns that are far away from city, there are usually more spaces available for new HDB flats, so people have higher chances to get BTO flats instead of buying resale HDB. As a result, the resale price tends to drop after the cooling measures take place.
Travel time to CBD matters
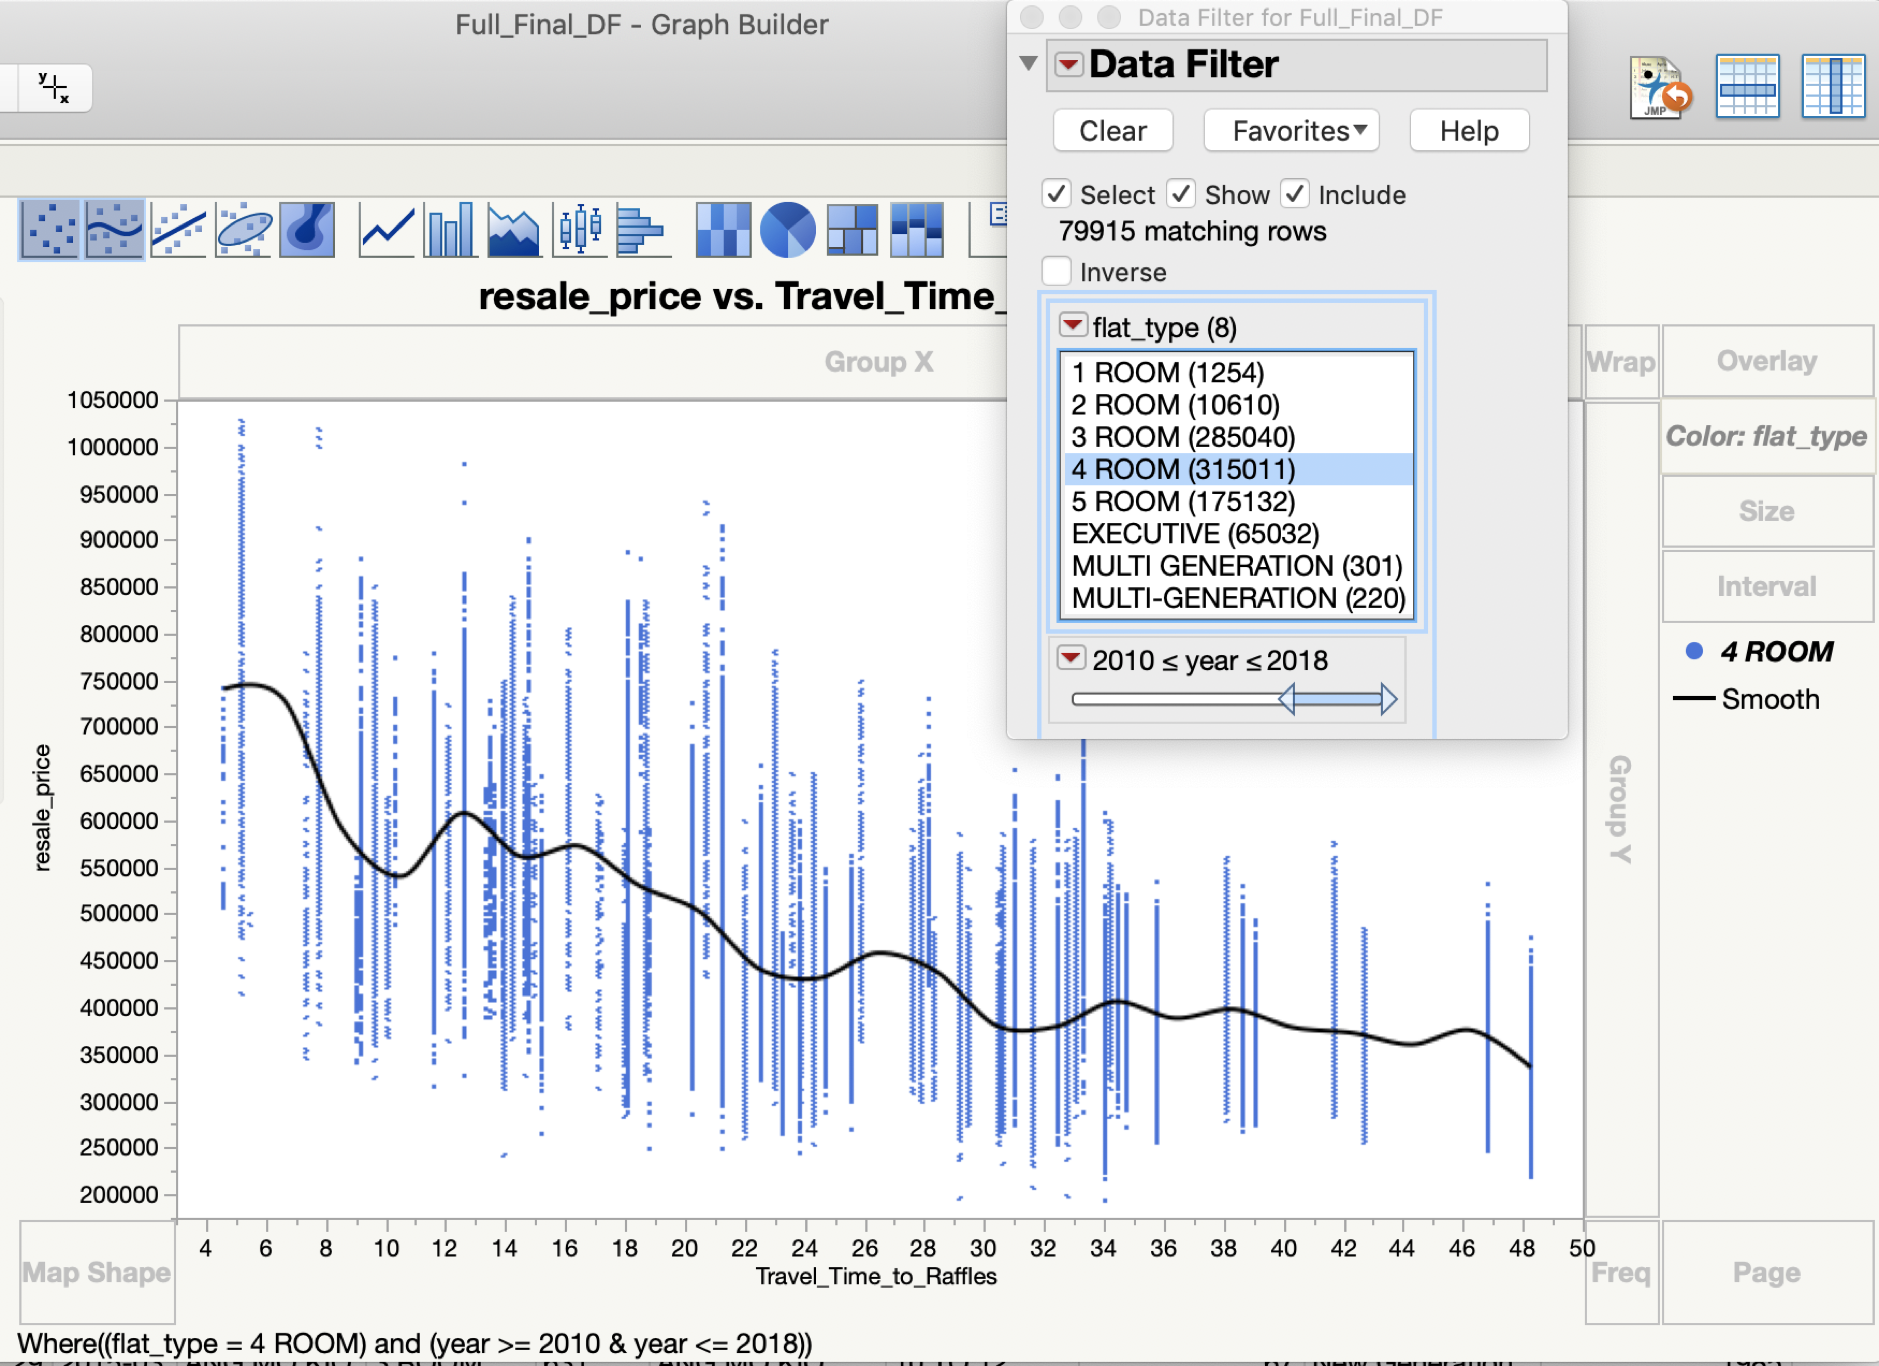
From previous analysis, we can see that center areas have a higher HDB resale price. In general, center areas means easier access to shopping malls and other facilities, more convenient transportation, etc. How is the travel time from different location to central area affecting the HDB resale price?
 4 ROOM HDB from year 2010–2018, median resale price v.s. travel time to Raffles Place MRT
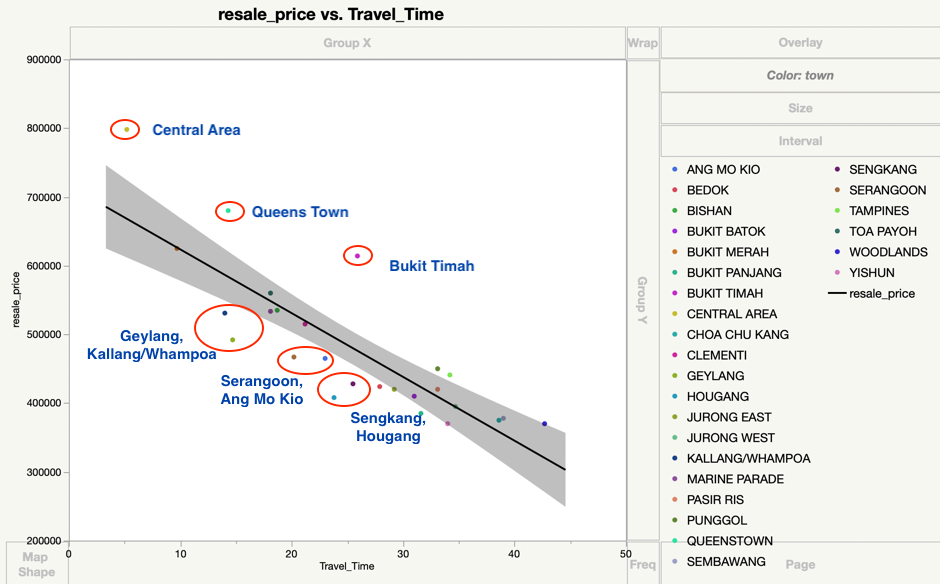
From this plot we can see a good linear correlation between HDB resale price and travel time to Raffles Place MRT, which matches with our expectations as well. If only considering the travel time to CBD area, is there any under-valued town locations that buys can pay more attention?
 Median resale price v.s. Travel time to CBD (Raffles Place MRT)
This graph can give us some insights between town location and resale price. For HDBs in Central Areas, Queens Town and Bukit Timah, they generally have a higher resale price than rest towns with similar travelling time. In other words, these HDBs are potentially over-priced if only talking about their relative distance to downtown area. On the other hand, HDB flats in areas such as Geylang/Kallang, Serangoon and Ang Mo Kio may be a good deal for potential buyers who want to stay closer to CBD and with a limited budget. These town areas are more cost-effective considering they have a lower price comparing with other towns with similar travel time to downtown(could be as much as ~200K).
Choosing a flat-type for modelling
Last but not least, I plot the HDB resale price v.s. year, partitioned by different flat types.
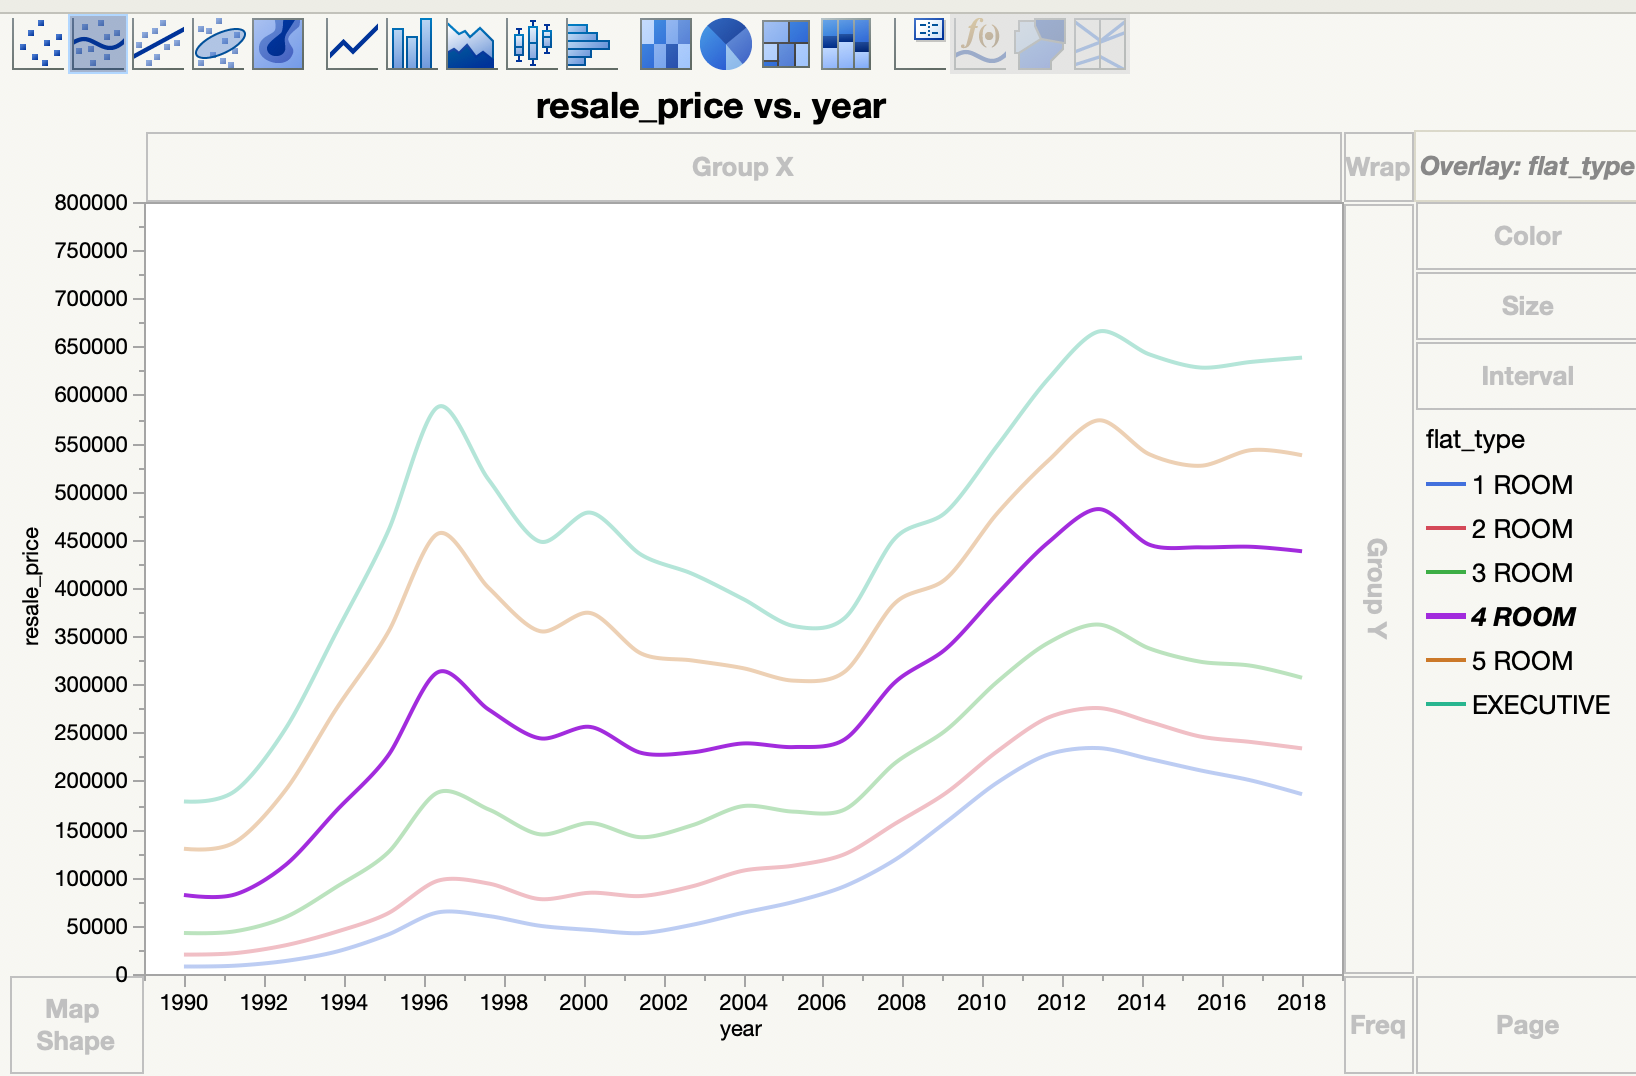 HDB Resale Price v.s. year, partitioned by flat type
Not surprisingly this time, we can see that the general resale price trends for different flat types are similar. Since we have enough data samples (>850K rows of data in total), I decided to choose 4 Room flat type for modelling, as it is the most popular flat type in Singapore. In addition, I only used the data samples from year 2005 onwards, since more recent data would be more representative and relevant for future HDB resale price prediction.
After exploring more about the data, we now get to know about the dataset. It is time to start modelling! The details will be shared in the next post.
Thanks a lot for reading!
